February-
March 2023
Servant's Heart
------------------
|


What the Data Tells Us: Lessons From Know Your Community
By Eddie Moody
What is your community like, and what is the implication for your ministry? More than 7% of all Free Will Baptist churches in the National Association have completed a Know Your Community (KYC) report on their neighborhoods. These reports are provided in partnership with Church Answers and consist of U.S. Census Data and ESRI (Environmental System Research Institute) information. This sampling of churches provides a picture of the neighborhoods where Free Will Baptist churches are located and the opportunities available to our churches.
Opportunities Everywhere
Over 73% of all U.S. counties experienced population decline last year. [1] However, 75% of the communities surrounding the churches that completed the KYC report grew. It is unclear whether this is a result of sampling bias (perhaps churches in growing communities are more likely to participate in KYC). Regardless, a significant percentage of Free Will Baptist churches are located in growing communities. The world is coming to our neighborhoods!
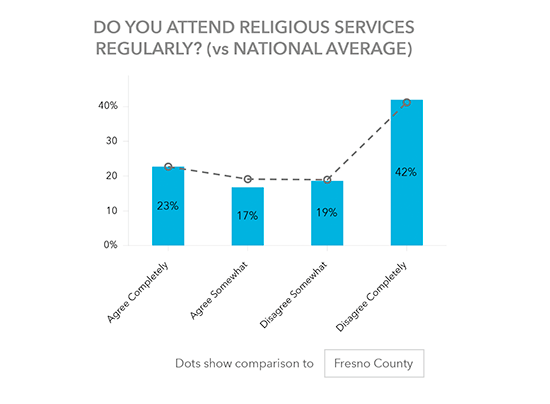
The fields are white and ready for harvest. Though many of our churches are in the “Bible Belt,” most have significant numbers of unchurched people. On average, when asked about attendance at religious services (e.g., church, mass, mosque, synagogue), 33.63% replied with “Disagree Completely.” The graph below reflects typical attendance.
The Needs Are Great
The spiritual, physical, financial, and emotional needs of our communities are great. We will report on only one measure—widows. Free Will Baptist churches average 8,111 widows in their communities. This number is expected to increase, since women aged 60-64 are the most frequently occurring group (24% of the churches). This and other needs identified in individual communities provide ministry opportunities.
Speaking of Age
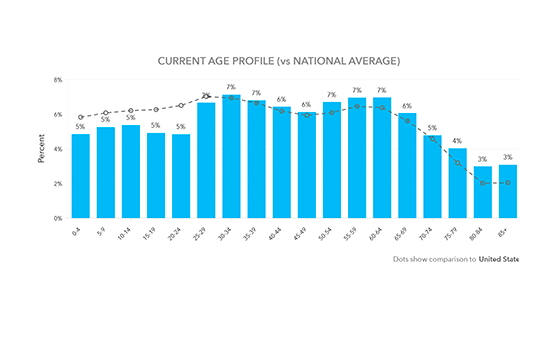
Your community may be unlike the overall U.S. As seen in the chart below, the age profile of one church’s community is compared to the U.S. population. This community is much older on average. During the feedback session with this church, they indicated they had been concerned because they had more older people than younger people in the church. In actuality, the church simply reflected the community around it.
Every Community Is Different, Even From Other Nearby Communities
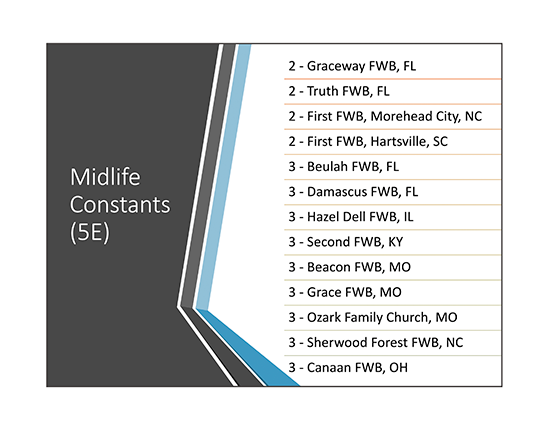
When examining a particular community, it becomes clear every community is unique. Therefore, tactics or strategies from one setting may or may not work in another. Using another church’s strategies would be like a physician prescribing medication without conducting an examination. Repeatedly, churches find more in common with churches from other states or regions (or even the opposite coast) than with other churches in their own states. Below is an example based on a Michigan church. Note that churches most similar to this congregation are located in other states.
A Tale of Two Churches: Ministry Implications
KYC reports typically focus on the top 20 segments in each community. Note that Church A below only has five groups, and one group (Economic Bedrock) consists of 70% of the community. This is a very monolithic community. In fact, each tapestry segment is native to this community. On the other hand, the profile of Church B shows 20 segments covering 83.7% of the church’s community population.
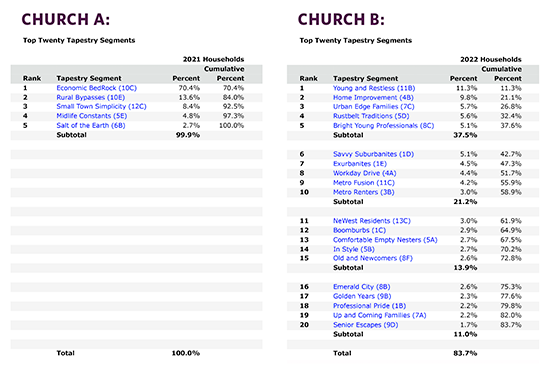
Further, you might say many of these segments are not native to the community and can be more challenging to reach. Interventions utilized to reach the Church A community might seem foreign to the Church B community. Further, a minister accustomed to ministering
at Church A would find great challenges if he moved to Church B and vice versa. Context is critical and must be considered to minister effectively.
What are Psychographics?
The tapestry segments listed previously are psychographic groups. Although the demographics (age, gender, income, language, ethnicity, marital, and ability status) of each community are described in the KYC report, psychographics may be more important. Psychographics involve the study of activities, attitudes, personalities, and values of individuals and cross-ethnic groups. According to KYC, there are 65 psychographic groups in the U.S.
Be Intentional
When we learn about psychographic groups, we follow the teachings of 1 Corinthians 9 by enabling our churches to be intentional about reaching each group. For example, if we learn about the activities and behaviors of a group, we know where to find them and areas in which we can engage them.
Reaching People
Psychographic groups or tapestry segments are not necessarily confined to one region. There are 16 tapestry segments of which 50 or more Free Will Baptist churches have high percentages in their communities (see graph on page 58). Free Will Baptists are effective in reaching some of these groups (i.e., Heartland Communities, Southern Satellites, Green Acres). On the other hand, we struggle to reach other groups (i.e., Bright Young Professionals, In Style, Old and Newcomers). However, if we have 50 or more churches with a significant number of these groups, we must try to seek them.
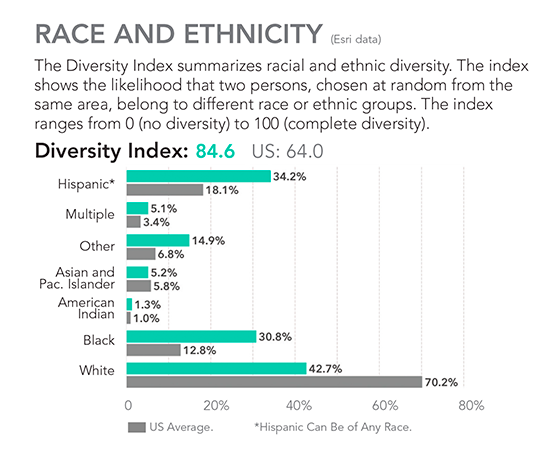
Above is data for the psychographic group Metro Fusion, a very diverse group. Every psychographic group has a diversity index. Metro Fusion is 84.6. The higher the number, the more diverse the group. As a church, if you reach the Metro Fusion psychographic group, you will reach people from diverse ethnic groups: Hispanics (34.2%), Blacks (30.8%), and whites (42.7%). Rather than thinking, “I need to reach Hispanics” (a diverse rather than a monolithic group), it is likely more effective to focus on psychographics.
Psychographic information informs us about interests we share with the group and various means we can use to
reach them.
Every Community Is Different
Growing Together. It can be difficult to use the KYC information to reach unfamiliar groups. One way we are working to reach these groups more effectively is through Growing Together: Know Your Community Subculture Discussions. We have working groups for Old and New Comers, Traditional Living, College Towns, Comfortable Empty Nesters, Savvy Suburbanites, and In Style. In these groups, churches discuss ways to reach these groups and work to create templates of outreach activities for each group.
Additionally, each church that participates in KYC receives Excel files allowing them to identify churches with similar profiles. This allows churches to work together toward a common goal. We also provide meetings with churches to discuss their KYC report results together to identify actions they can put into practice.
Next Steps
Information without action is useless. We encourage all our churches to get to know their communities and take the necessary steps to reach them. Currently, 12 Free Will Baptist churches are part of a pilot program with Church Answers to develop The Hope Initiative, a prayer and outreach strategy churches can use to reach their communities.
The Hope Initiative focuses on praying for and reaching the church’s community. We hope our churches use this vital information about their communities to pray more for them more specifically and to reach them with the gospel more effectively. To learn about any of these resources, call us at 877-767-7659, visit nafwb.org/know, or email questions@nafwb.org.
|
|